Tombstones

Unlike RDBMS databases, Cassandra will not do in place update, delete or any modification, deletes are also kind of inserts and it will follow the rule of Last Write Wins(LWW). The data is always written to the immutable files called SSTABLES, In the context of Cassandra, a tombstone is specific data stored alongside standard data. A delete does nothing more than insert a tombstone.

Tombstones will not be cleared until certain time, which can controlled by the parameter gc_grace_seconds in cassandra.yaml file

Why tombstones will not be cleared until certain time?

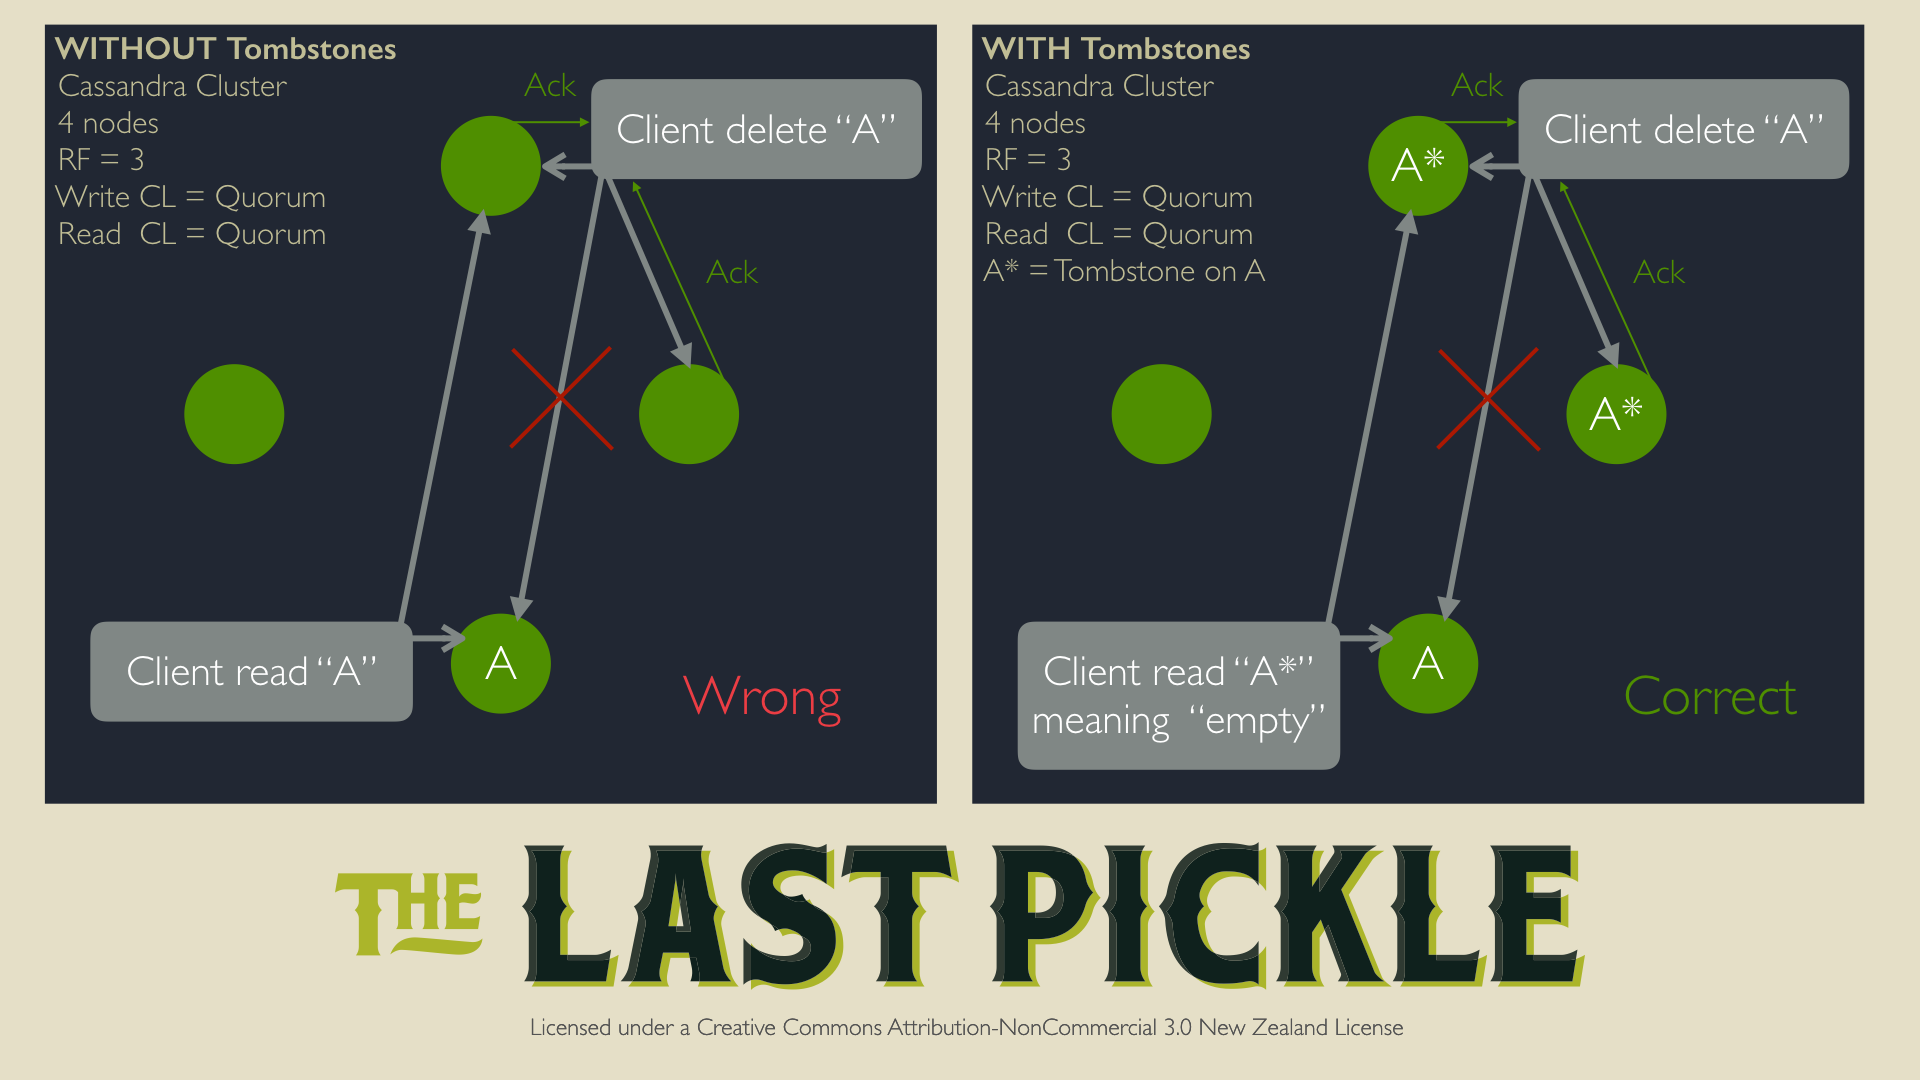
As it is distributed database, suppose a delete happens with a Replication Factor of 3 and Consistency Quorum, before acknowledging to the client node, Cassandra will make sure that data is written to 2 out of 3 nodes, however as RF is 3 the data will be written to 3rd node also eventually. Even if the 3rd node is down by the time deletes were happening, Cassandra will consider this as successful transaction. Because it satisfied the consistency level. So once the third node is up there will be no deleted data in that node. So if the user try to read, the next read involving that node will be an ambiguous read since there is no way to determine what is correct: return an empty response or return the data? Cassandra would always consider that returning the data is the correct thing to do, so deletes would often lead to reappearing data, called “zombie” or “ghost” and their behavior would be unpredictable.

So as a workaround for this Cassandra introduced a parameter gc_grace_period, the default value for this parameter is 1064000(10 days), when there are huge deletes it is always good to run repair before the gc_grace_period.

Tombstones will cause performance issues, Cassandra will read the tombstones while reading the actual data. There are two parameters in cassandra.yaml that will help to log and abort when the query exceeds scanning certain no. of tomstones.

tombstone_warn_threshold (default: 1000): if the number of tombstones scanned by a query exceeds this number Cassandra will log a warning in system.log
(which will likely be propagating to your monitoring system and send you an alert).

tombstone_failure_threshold (default: 100000): if the number of tombstones scanned by a query exceeds this number Cassandra will abort the query.
The is a mechanism to prevent one or more nodes from running out of memory and crashing.

Ways to clear tombstones

Tombstones will be cleaned regularly, over time, by compactions(Please verify compaction article to know when will a compaction triggers and about types of compaction). In some cases because of shadowed data or due to a bulk delete, tombstones are not cleaned quickly enough, and can cause queries to fail (because of tombstone_fail_threshold) or nodes to be overloaded (because of the processing overhead). In these cases, there are a few ways to clean them aggressively (at the cost of using more system resources while the cleaning is being done).
 

A major compaction on the table, one node at a time will compact all the sstables together into one big sstable, So in the case of SizeTieredCompactionStrategy, you can use the ‘-s’ option when doing the compaction, but with TimeWindowCompaction -s will not help and all the sstables will be combined to one big sstable, so it is advised to then stop DSE and use sstablesplit to split the table into manageably-sized sstables.  

A minor compaction( less invasive approach) is to tune the compaction sub-properties for the table’s compaction strategy, tombstone_threshold(Default value is 0.2, If the ratio exceeds this limit, Cassandra starts compaction on that table alone, to purge the tombstones) and tombstone_compaction_interval(Default value is 1 day(86400). The minimum number of seconds after an SSTable is created before Cassandra considers the SSTable for tombstone compaction. Cassandra performs tombstone compaction on an SSTable if the table exceeds the tombstone_threshold ratio) . These parameters can altered in table definition to clean tombstones more aggressively. Also, in SizeTieredCompactionStrategy, the min_threshold(the default value is 4, The minimum number of SSTables to trigger a minor compaction) for compaction can be reduced to compact sstables more quickly.

One more approach is to use “nodetool garbagecollect” then either perform single-sstable compactions on the sstables, or run garbagecollect a second time, to clean out partition-level tombstones. On the first run, garbagecollect clears out the deleted (or “shadowed”) data that tombstones mark. On a second run, or during later compactions, if there’s a tombstone that deletes an entire partition, and that partition is not in other sstables, the tombstone can be safely cleaned out. (For tombstones that shadow individual rows or cells, it’s not as easy to drop them, and they won’t be cleaned out by garbagecollect or a single-sstable compaction.)

‘nodetool garbagecollect’ clears deleted data from sstables. —–What is actually a deleted data ?

suppose you insert bunch of rows and do nodetool flush, again you delete few records of the same inserted rows and you flush again,
now you have 2 sstables, one with tombstones and other with data that is shadowed by tombstones.

Garbagecollect actually helps to clear deleted data in first sstable that is no longer needed because it is shadowed by tombstones in the second sstable.
Which in turn helps to clear tombstones in second sstable. “nodetool garbagecollect” does not generally drop the tombstones even after gc_grace_seconds,
it can be used to reclaim space, or to make it more likely that tombstones will be dropped in subsequent compactions.

Troubleshooting network issues

Troubleshooting network connectivity issues like connection refused or connection is hanging due to port issues.

Step 1.

Verify ping time from both ends(source and destination)

ping 10.10.10.11

Ping time of 100 ms and below are average for most broadband connections. So there will not be any lag.

While a ping of 150 ms or more may not be helpful and there will be a lag.

Step 2.

Verify whether the port is listening or not, using netstat or nc.

netstat -ntl|grep 7199

tcp 0 0 0.0.0.0:7199 0.0.0.0:* LISTEN

Or can verified as below

nc -lk 7199

nc: Address already in use

When the port is open and when none of the processes is listening then the above command(nc -lk) will start listening on a specific port.

Step 3.

Check if the port is open or not for the remote server. Login to source server and try to connect remote server using any one of the following methods(telnet, nc, and nmap).

telnet 10.10.10.12 7199

Trying 10.10.10.12…

Connected to 10.10.10.12.

Escape character is ‘^]’.

^] — ctrl+ ]

telnet> quit

nc -zvw3 10.10.10.12 7199

Connection to 10.10.10.12 7199 port [tcp/*] succeeded!

nmap -sT 10.10.10.12 -p 7199 -Pn

Output should show as open, should not show as filtered or closed .

Step 4.

Acknowledgment between the server’s ports can be verified using ngrep or tcpdump.

For example

sudo tcpdump tcp port 7199

Or

tcp port 7199 -w trace7199.pcap –to save in file

tcpdump: verbose output suppressed, use -v or -vv for full protocol decode

listening on eth0, link-type EN10MB (Ethernet), capture size 262144 bytes

21:07:35.356796 IP ip-10-10-10-11.srv101.dsinternal.org.47608 > ip-10.10.10.12.srv101.dsinternal.org.7199: Flags [S], seq 1054145878, win 29200, options [mss 1460,sackOK,TS val 989707819 ecr 0,nop,wscale 9], length 0

21:07:35.356836 IP ip-10.10.10.12.srv101.dsinternal.org.7199 > ip-10.10.10.11.srv101.dsinternal.org.47608: Flags [S.], seq 3203231434, ack 1054145879, win 28960, options [mss 1460,sackOK,TS val 989707126 ecr 989707819,nop,wscale 9], length 0

Note: Check the length, if the length is 0, then nothing is getting pushed.

Or

sudo ngrep port 7199

T 10.10.10.12:46996 -> 10.10.10.11:7199

T 10.10.10.11:7199 -> 10.10.10.12:46996

Step 5.

Get confirmation from the network team whether the outbound or short time living port ranges are open or not, for example on Linux flavor we can verify range using the below command.

cat /proc/sys/net/ipv4/ip_local_port_range

32768 60999

Step 6.

Verify the outbound port’s connectivity by passing text between servers as below.

Server 1

Connect to local outbound port

cassandra@ip-10-10-10-11:~$ sudo nc -l 32768

Server 2

Connect to server 1 outbound port.

cassandra@10-10-10-12:~$ nc 10.10.10.11 32768

Now type the text on any server that should be viewed on another server terminal.

Datastax outbound port verification

Note:Please test vice-versa as well to verify the outbound port’s remote connectivity.

Step 7.

Check the firewall rules using iptables.

10.10.10.11:~$ sudo iptables -L

Chain INPUT (policy ACCEPT)
target prot opt source destination
Chain FORWARD (policy ACCEPT)
target prot opt source destination
Chain OUTPUT (policy ACCEPT)
target prot opt source destination

Step 8.

Finally, confirm with the networking team that they need to check inter-subnet firewall or firewall appliance policies that regulate traffic going to different subnets.

Specific to JMX Port 7199 or if nodetool is not working across the servers, then verify the following steps

Step 1.

Make sure whether the following parameters are in the cassandra-env.sh or in jvm.options file

-Dcassandra.jmx.remote.port=7199

-Dcom.sun.management.jmxremote.authenticate=false

-Dcom.sun.management.jmxremote.ssl=false

-Djava.rmi.server.hostname=10.10.10.11

Step 2.

Download the jmxterm application from any website or from (https://docs.cyclopsgroup.org/jmxterm) then test port 7199 as below

10-10-10-11:~$ java -jar jmxterm-1.0.2-uber.jar

$>open localhost:7199

#Connection to localhost:7199 is opened

$>exit

#bye

10-10-10-11:~$ java -jar jmxterm-1.0.2-uber.jar

$>open 10.10.10.12:7199

#Connection to 10.10.10.12:7199 is opened

Note:If the connection is hanging or the connection is refused then there is a chance for the above things, one is either 7199 or outbound ports are not open or might be due to the above parameters in step1.

Cassandra Memory

Cassandra memory consist of Heap memory + Off Heap Memory

Off-Heap Memory(Native Memory or Direct memory, which is managed by OS)

Heap Memory(Which is managed by Java)

Following are the part of Off-Heap Memory 

Partition key Cache
Row cache
Chunk cache
Memtable space   

Note:Depending upon memtable_allocation_type memtable, space can be in off-heap or in heap memory

Java take cares of heap memory and we have some control over heap space, Offheap or native memory is controlled by the OS(Operating System).

Here are the few parameters where we can control the heap space and off heap space

We can set the maximum heap size in the jvm.option file on a single node. For example:

-Xms48G
-Xmx48G

Set the min (-Xms) and max (-Xmx) heap sizes to the same value to avoid GC pauses during resize, and to lock the heap in memory on startup.

We can set memtable size and threshold for the flush of memtable data in cassandra.yaml on single node. For example

memtable_cleanup_threshold: 0.50   -- Once it reaches 50% the memtable will be flushed from memory            
memtable_space_in_mb: 4096 --- Default heap memory is 1/4th of the heap

We can manage off heap space or native memory or max direct memory in jvm.options or cassandra-env.sh, for example in jvm.options we can set as below.

-XX:MaxDirectMemorySize=1M

Note: The default value when MAX_DIRECT_MEMORY(XX:MaxDirectMemorySize) is not set is (MAX_SYSTEM_MEMORY – MAX_HEAP_SIZE) / 2, When this property file_cache_size_in_mb. is not set, the chunk cache size is set to 1/2 of the maximum direct memory,If no maximum direct memory is set, then the cache size will be set to ⅓ of the system memory

Scripts for troubleshooting OOM issues

The following will help to check if bloomfilter is taking huge space

for i in {1..10}; do nodetool sjk mx -mg -b 'org.apache.cassandra.metrics:type=Table,name=BloomFilterOffHeapMemoryUsed' -f Value; date ; sleep 10; done

The following will help the native memory is getting used

for i in {1..10}; do nodetool sjk mxdump -q "org.apache.cassandra.metrics:type=NativeMemory,name=*"; date ; sleep 10; done > $(hostname -i)_NativeMemory

The following will help for leaks detection.

for i in {1..20}; do nodetool leaksdetection; sleep 30; done > $(hostname -i)_leaksdetection.txt

Try to reduce heap and native memory to control OOM issues.